Poultrix · Jul — Dec 2025
Predicting disease risk on poultry farms from sensor data
A sensor rig, an edge processor and an ML pipeline that warn poultry farmers about disease and mortality risk before the flock shows symptoms.
Context
Commercial poultry farming runs on narrow margins and short cycles. A broiler flock reaches market weight in about six weeks, so a problem that goes unnoticed for two days is a problem that has already cost the farmer part of the batch. The signals that matter — a shed warming unevenly, ammonia climbing overnight, water consumption dropping before feed does — are all measurable. On most of the farms this project was built for, none of them were being measured. Conditions were checked by walking into the shed, and the record of what happened was whatever the person who walked in remembered.
I led the software on Poultrix from July to December 2025: the firmware on the sensor nodes, the edge processing, the cloud pipeline, the models, and the dashboard the farmer actually looks at.
Problem
Three constraints shaped everything.
Farms have bad connectivity. Sheds are often metal, often rural, and the uplink is a mobile connection that drops for minutes at a time. Any design that assumed a live connection to the cloud for every reading was going to fail in the field.
Raw sensor data is mostly noise. Sampling five channels at a useful rate produces far more data than is worth transmitting or storing, and almost all of it says "nothing changed." Sending it all would have burned the data budget and buried the signal.
The alert has to arrive early enough to act on. A dashboard that reports a mortality event is a record, not a tool. To be worth installing, the system had to flag elevated risk while there was still time to ventilate, adjust feed, or call a vet.
Approach
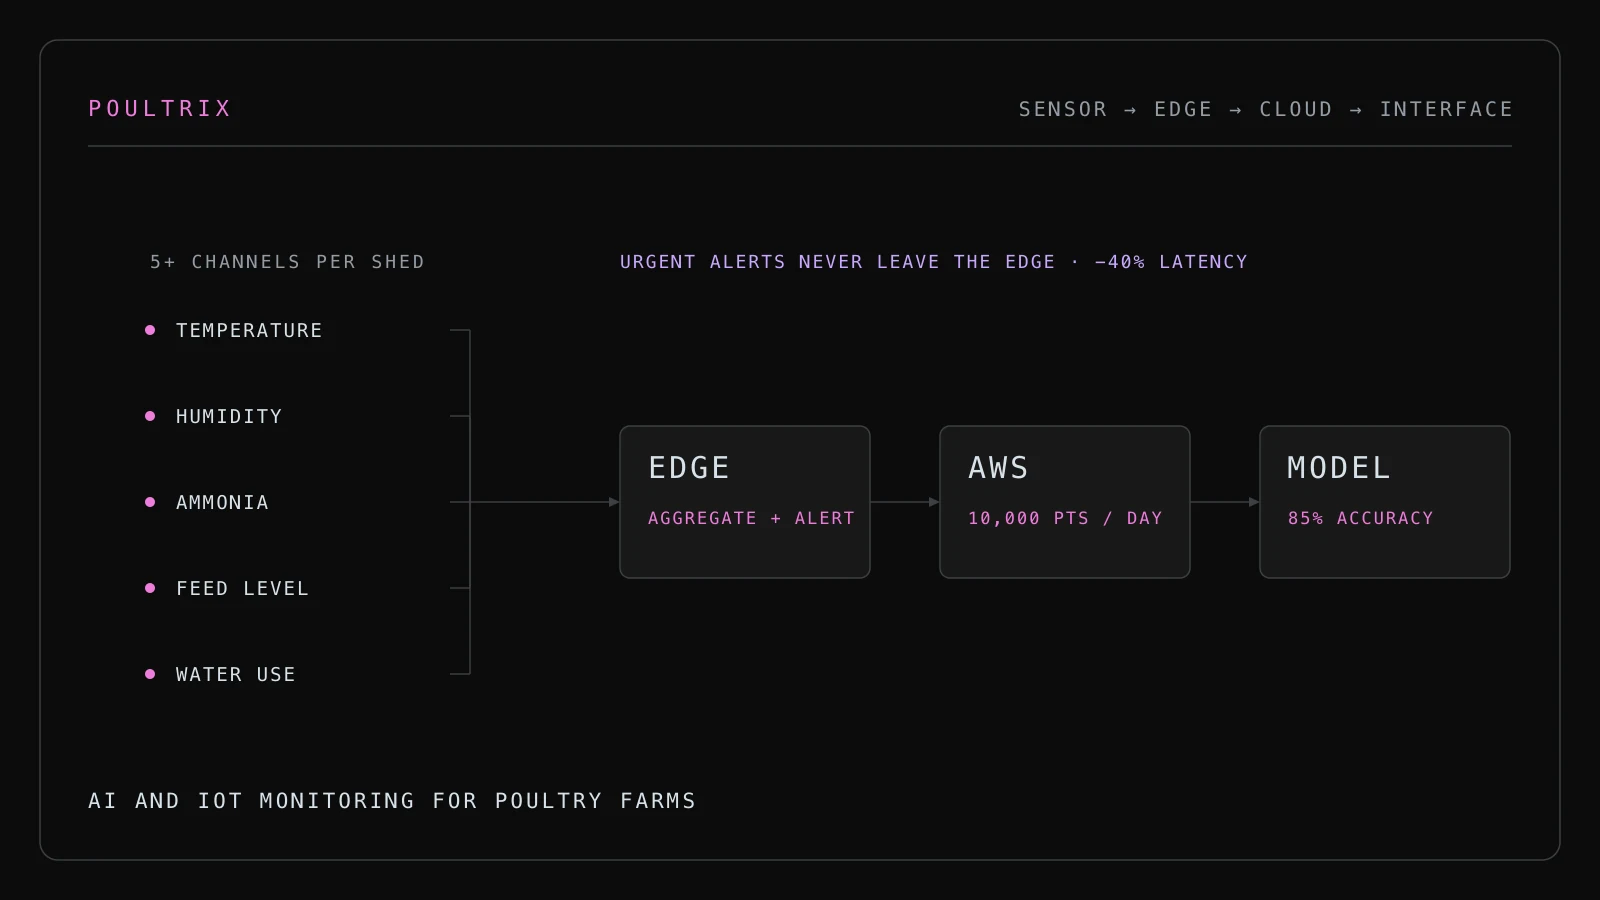
The system is four layers, and the design work was mostly about deciding what belongs in each one.
Sensing. Each shed gets a node built around an ESP32 reading five or more environmental channels — temperature, humidity, ammonia, feed level and water consumption. The firmware samples continuously at a rate matched to how fast each signal actually moves, which is not the same across channels. Ammonia is worth reading often. Feed level is not.
Edge. The node does not forward raw samples. It aggregates over a window, computes the statistics the models downstream actually consume, and evaluates a small set of threshold rules locally. Anything that crosses a hard threshold — a temperature spike, an ammonia ceiling — fires an alert from the node itself, without waiting for the cloud. Everything else is batched and uploaded. This is what produced the 40% cut in response latency: the urgent path stopped making a round trip.
Cloud. Aggregated readings land on AWS, roughly 10,000 data points a day across the deployment. Storage is partitioned by farm and by shed, which matters later for the multi-farm view and for keeping one farm's history from being scanned when another farm's dashboard loads. Inference runs against the stored series rather than the live stream, which means a dropped uplink delays a prediction but never loses one.
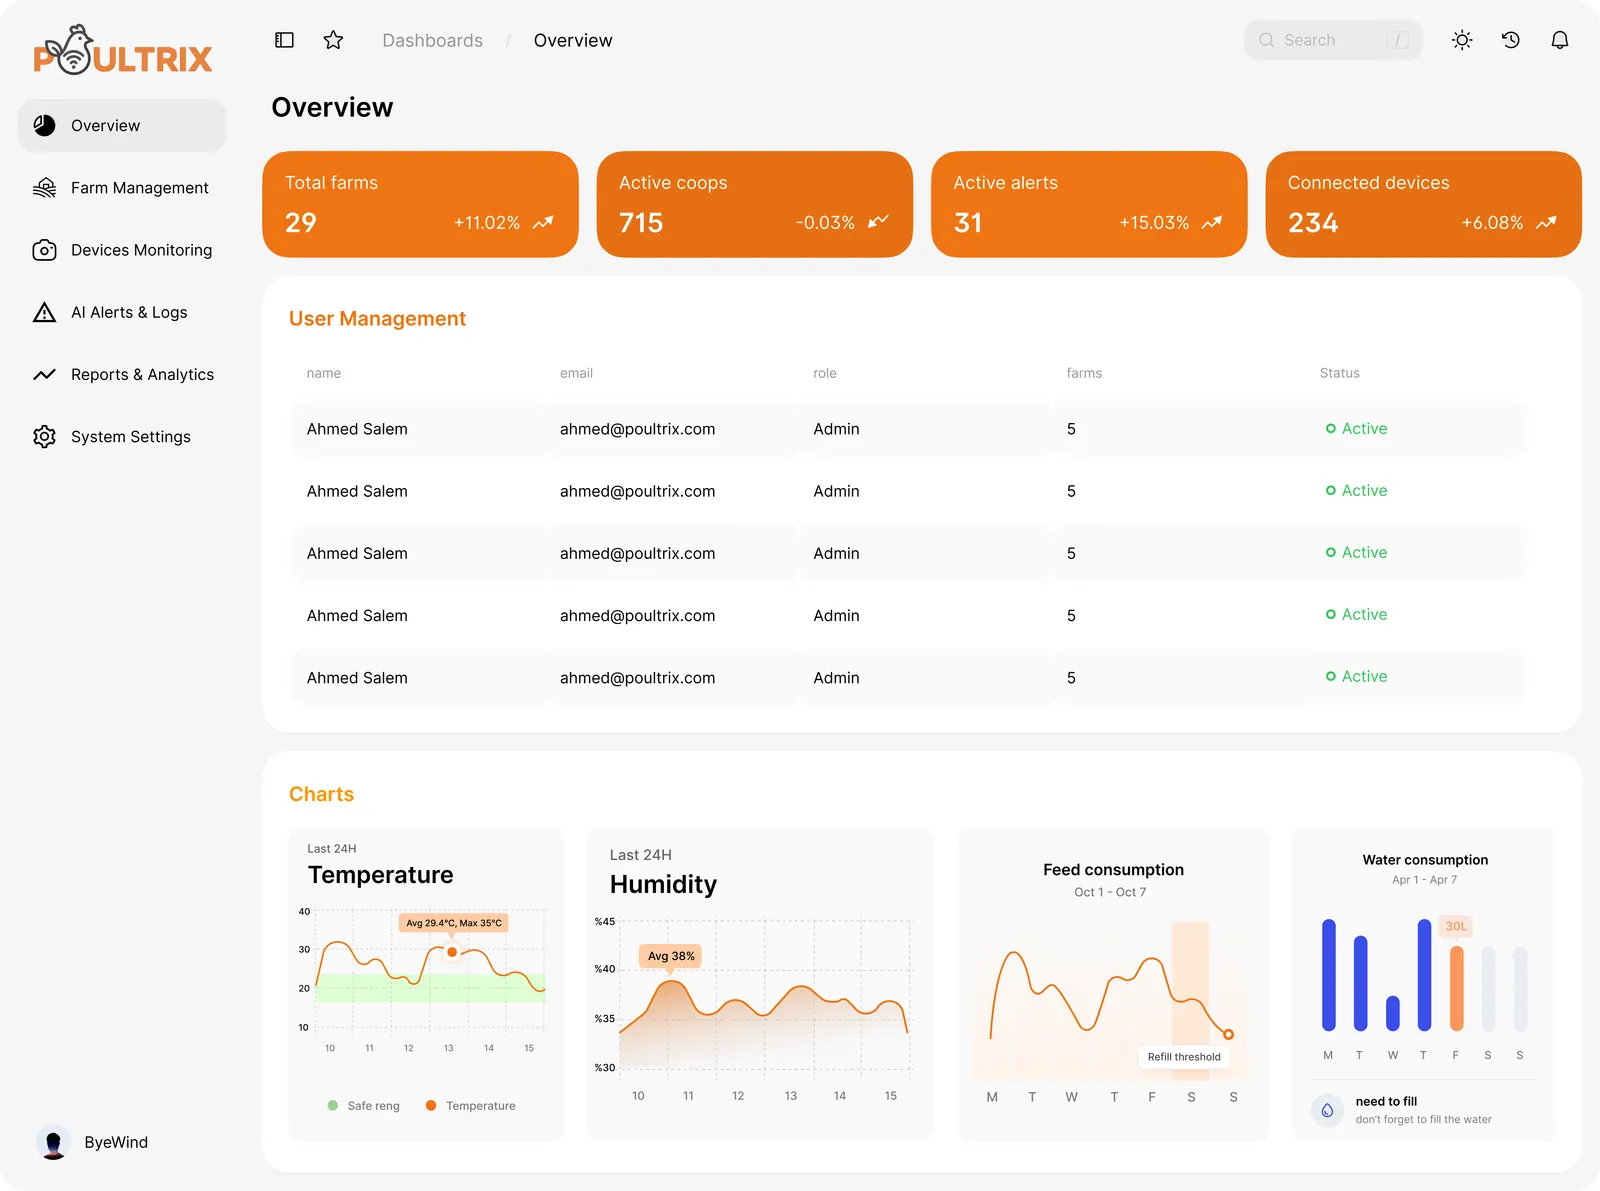
Prediction and interface. The models score disease and mortality risk from the environmental series and reach 85%+ accuracy on the validation set. The output is not a number the farmer has to interpret — it is a risk level attached to a specific shed, with the readings that drove it. The Flutter dashboard shows one farm or many, so an operator running several sites gets a single ranked list of what needs attention.
Decisions and trade-offs
Processing at the edge instead of in the cloud. The obvious architecture is thin sensors and a fat cloud: stream everything, decide everything centrally. It is easier to build and much easier to change. I did not do it, because the two things that mattered most — latency on urgent alerts, and behaviour during a connectivity drop — both get worse in that design. Moving aggregation and threshold rules onto the node cost real complexity: firmware became something that has to be versioned and updated in the field, and a rule change is now a deployment rather than a config edit. That is a genuine downside and it is the part of the system I would most want to improve with a proper over-the-air update channel.
Aggregating before transmitting. Sending only windowed statistics means the raw high-rate series is gone. If a model later needs a feature we did not think to compute, it cannot be recovered from history. I accepted that in exchange for a data budget that works on a rural mobile connection, and mitigated it by keeping the aggregation window generous and the statistic set wider than the first model needed.
85% as the target, and what the errors cost. Accuracy alone is the wrong way to read this system, because the two error types are not symmetric. A false negative means a missed outbreak. A false positive means a farmer walks into a shed and finds nothing wrong. The second is cheap; the first is not. So the operating point is tuned to favour recall, and the interface reflects that — a flagged shed shows the readings behind the flag, so the farmer can dismiss it in a few seconds rather than treating every alert as an emergency. A system that cries wolf gets ignored, and an ignored alert is worth nothing.
Multi-farm from the start. Single-farm would have shipped sooner. But the tenancy boundary is the hardest thing to add to a data model after it has real data in it, so farm scoping went into the schema before the first deployment rather than after.
Result
Poultrix runs the full path from a sensor in a shed to a ranked risk list on a phone: five or more channels per node, aggregation and hard-threshold alerting at the edge, around 10,000 data points a day processed on AWS, and models at 85%+ accuracy on disease and mortality risk. Edge processing cut response latency on urgent alerts by 40%, and the multi-farm dashboard gives an operator running several sites one place to look.
It is the project I point at when someone asks what I actually do, because there is no layer of it I handed to someone else.
The build
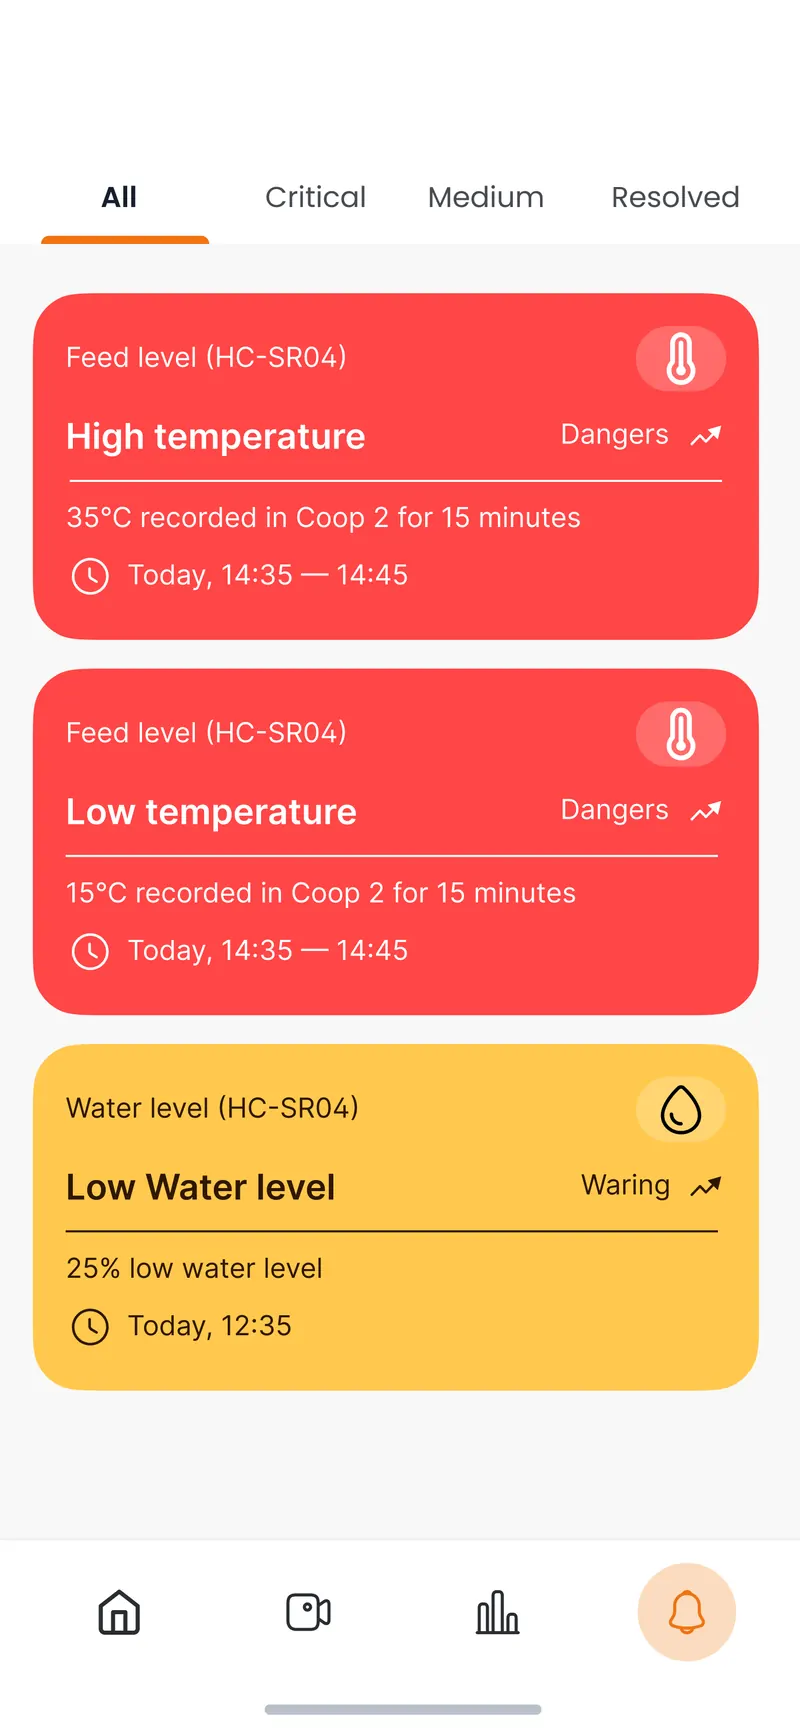
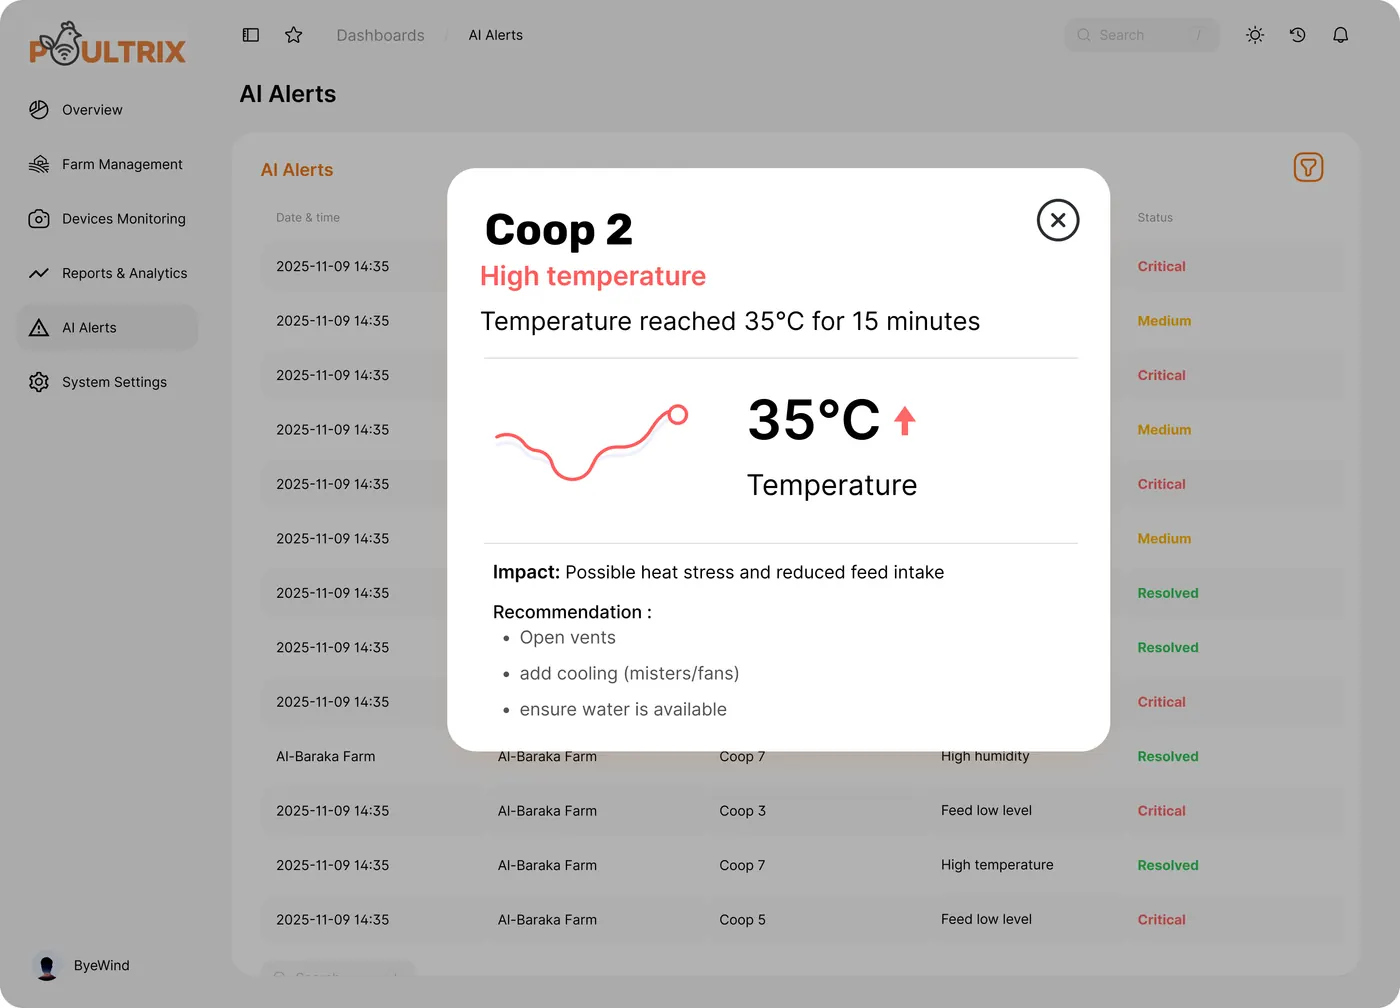
Every alert names the coop, the reading and the window it held for. A farmer should not have to go and look to know whether to go and look. 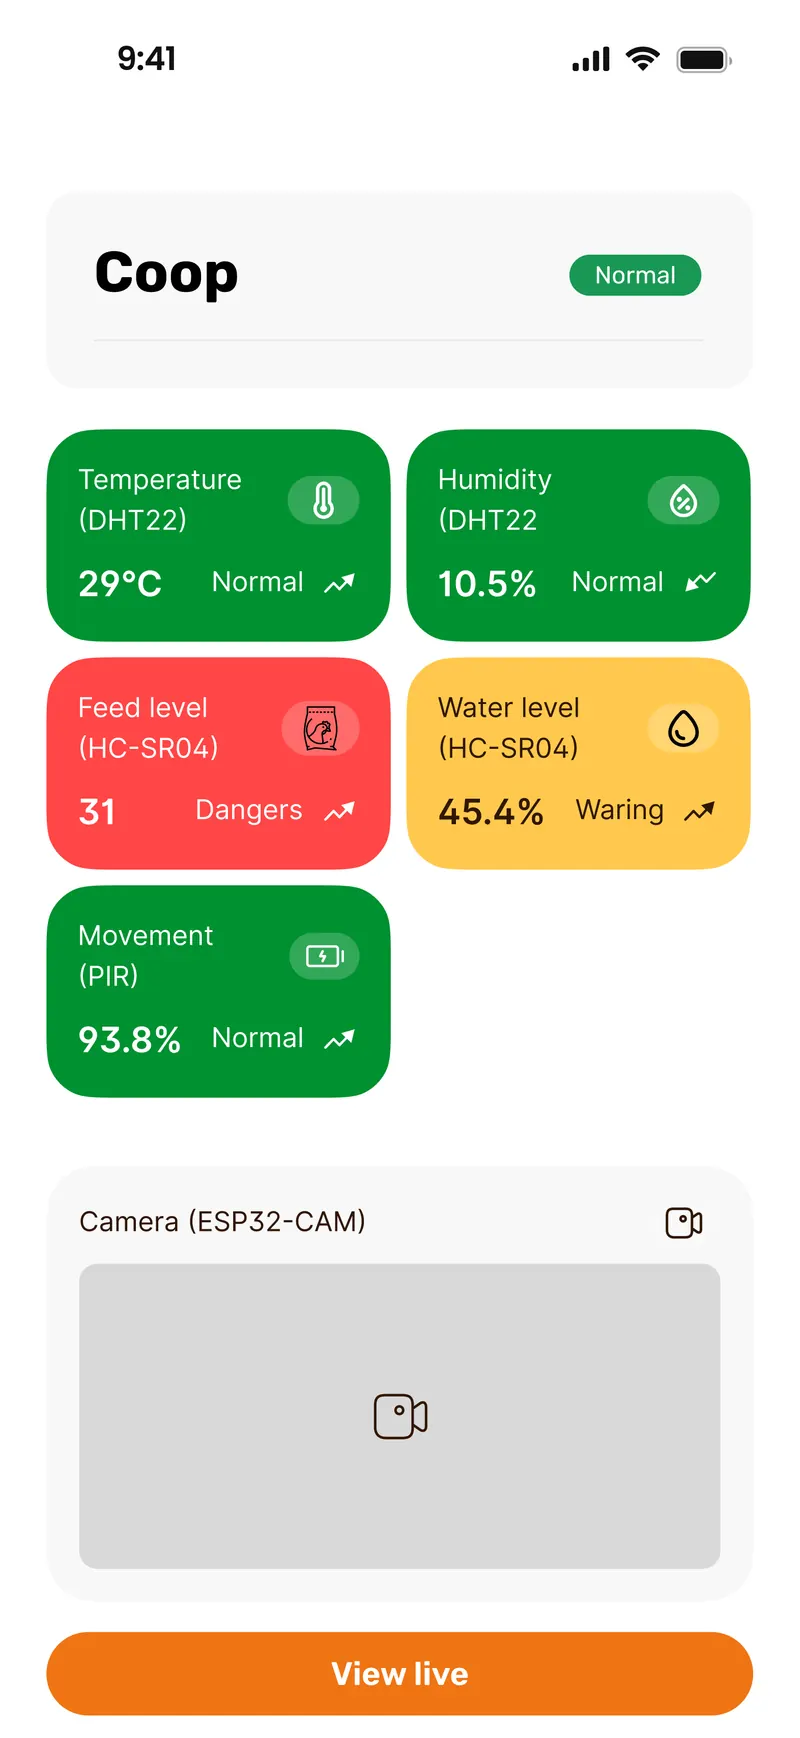
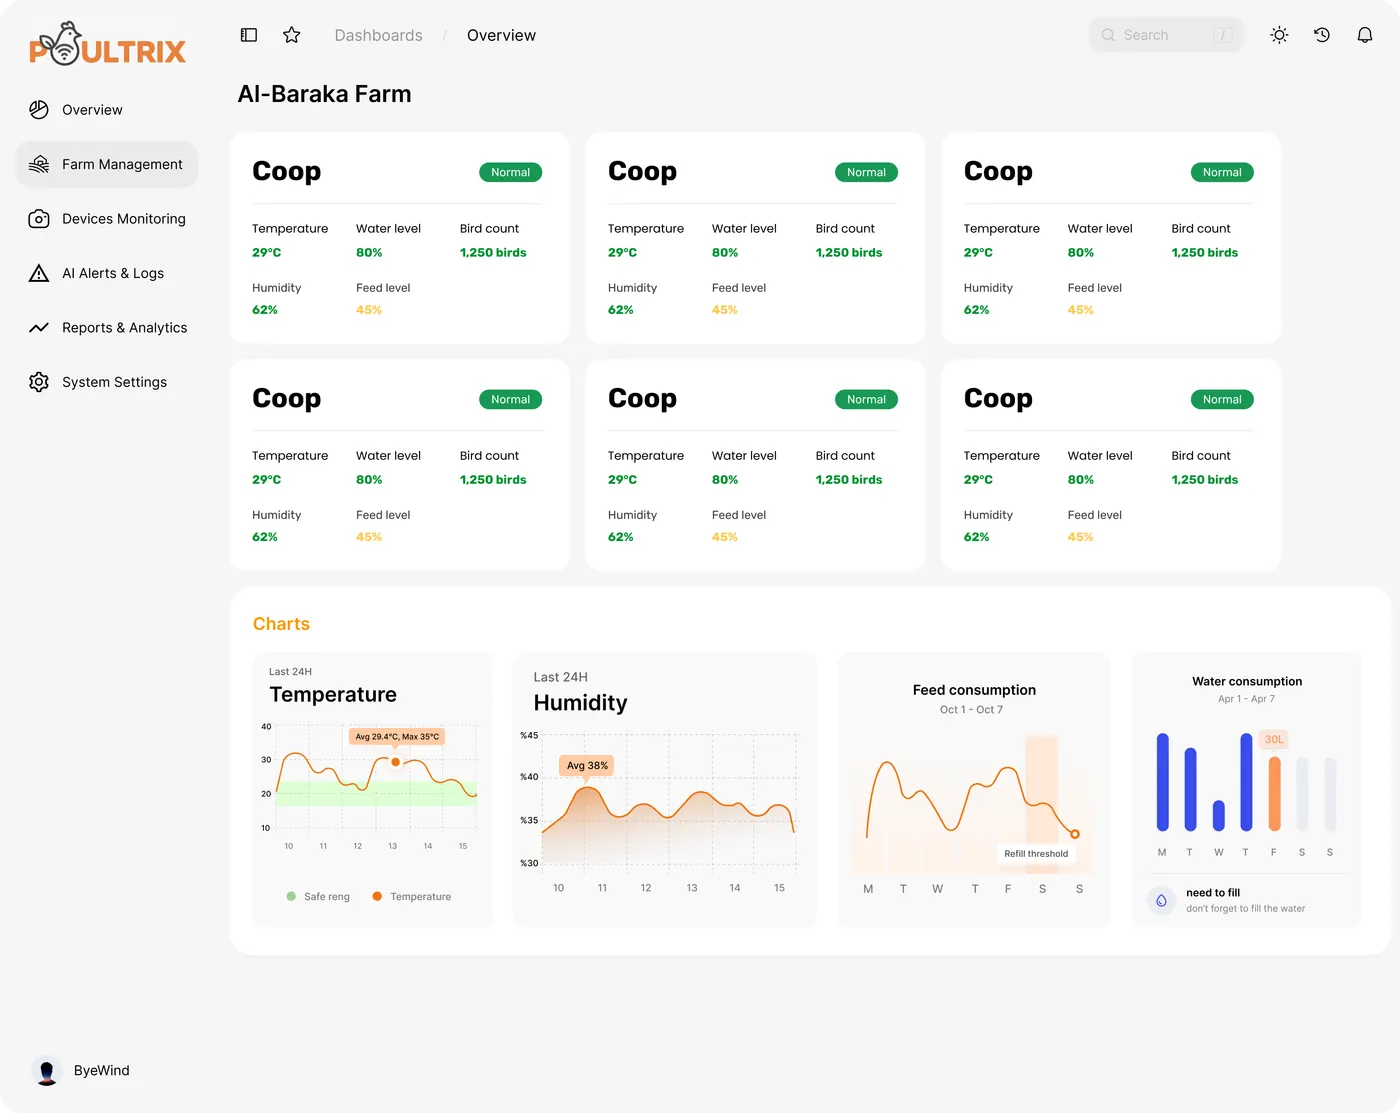
One coop, every sensor on it, and the camera — so the reading can be checked against the birds. 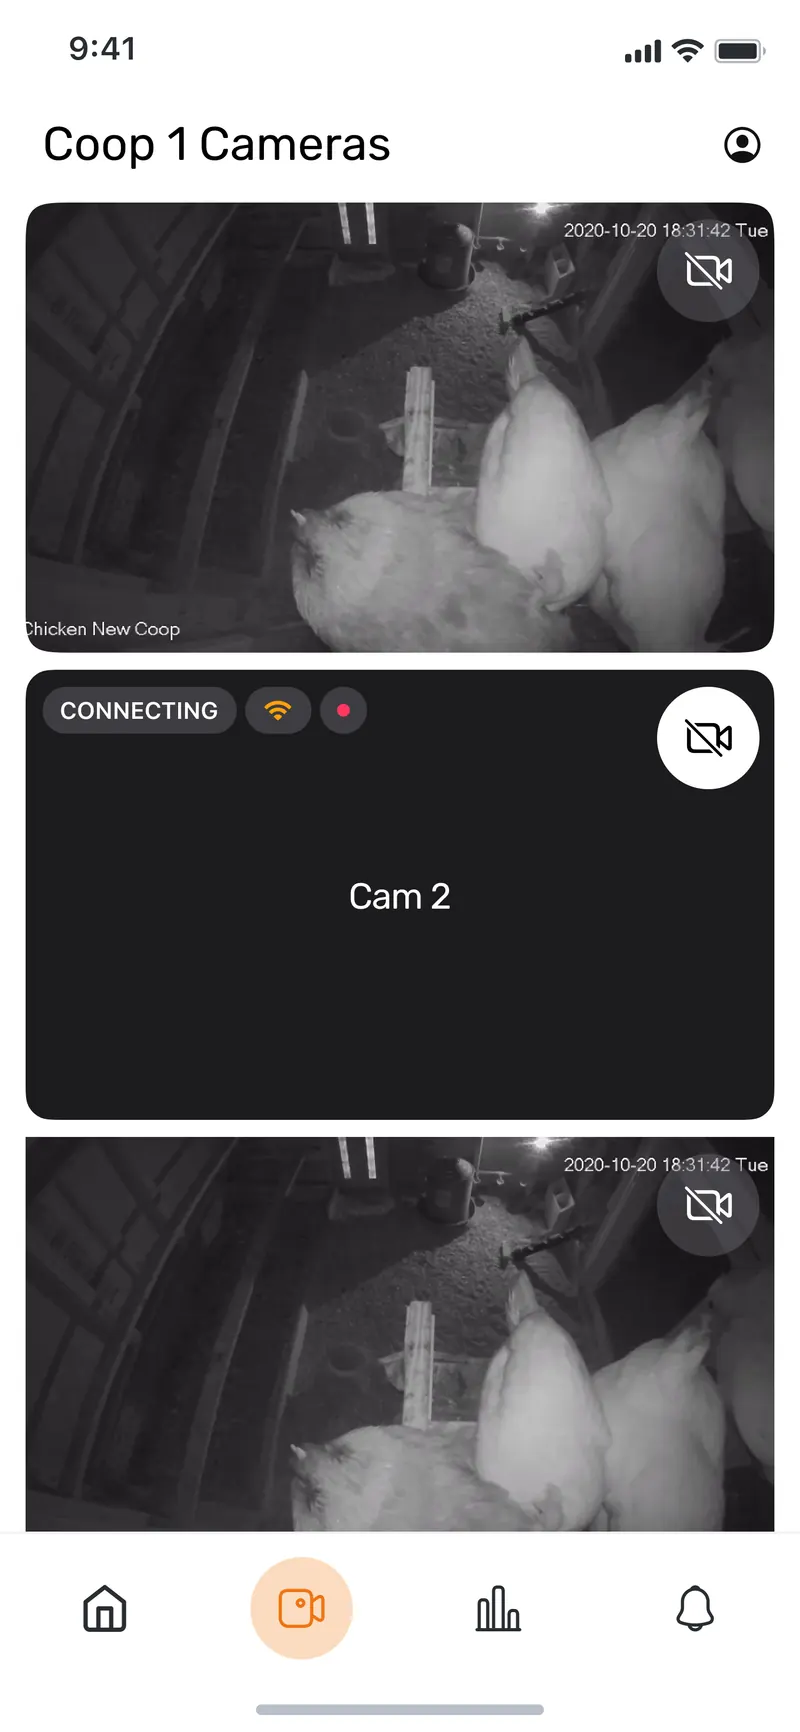
Infrared, because the alert that matters most arrives at night.
Want the detail behind any of this? Email me.